

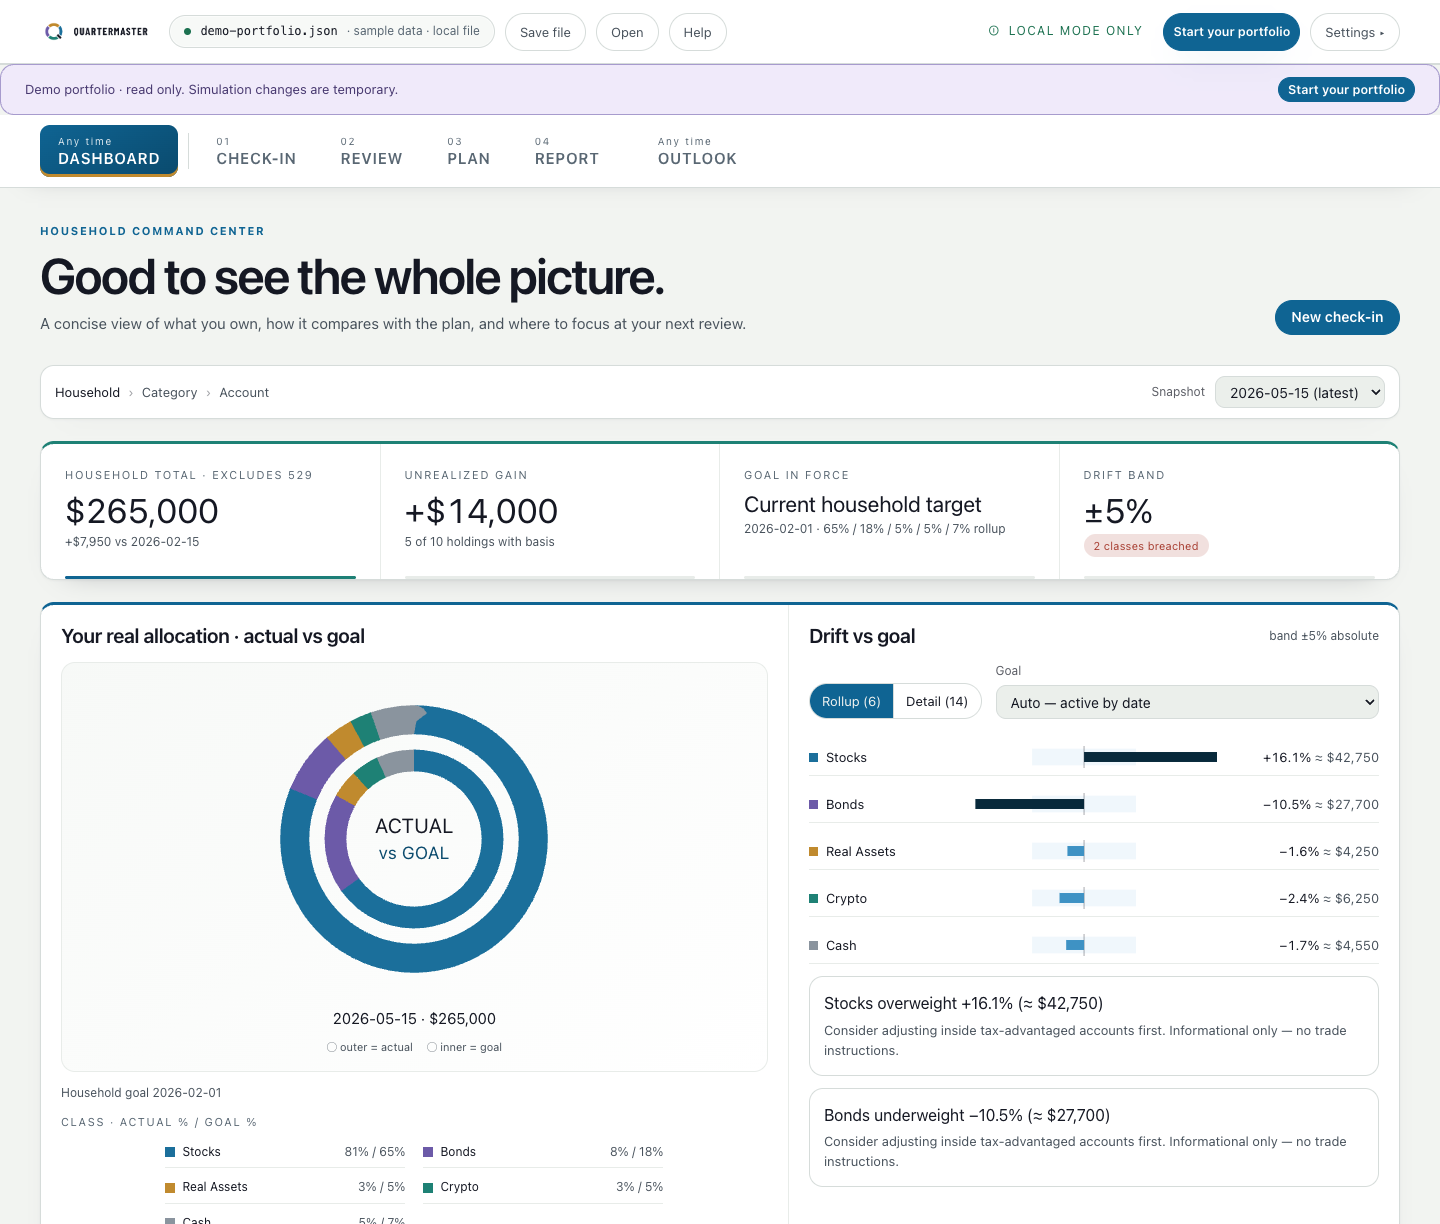
1Total portfolio value
$265,000Tracked investments across the household, excluding the 529 goal.
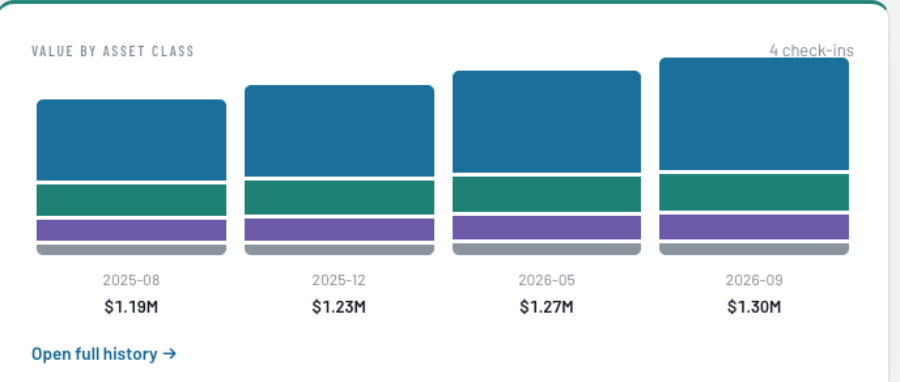
See your whole portfolio in one place, spot tax drag hiding across accounts, and check if it can fund your actual goals.
No account linking. Your portfolio data stays in a file you control. Privacy
 1
2
Tracked investments across the household, excluding the 529 goal.
Both are outside the household’s ±5-point review band.
Two costs, one clear view. Estimate annual ETF and mutual-fund expenses, then see how account placement affects distribution taxes. Unknown fund fees stay visible as unknown.
See your weighted expense ratio, estimated annual fund costs, and how much of your portfolio has fee data. Combine the same fund across accounts.
Compare estimated ongoing taxes across taxable and sheltered accounts. Keep fund costs and tax estimates separate, with a combined annual view.
Not the largest holding—the costliest placement in this sample.
Hold the bond exposure in the 401(k) and the equity exposure in taxable. Future 401(k) withdrawals may be taxable.
Single · $200K–$400K income · Massachusetts. Illustrative estimate based on the assumptions shown in the app. Tax effects are simplified and may omit future taxes, plan restrictions, trading costs, and changes in yields or law.
$90K annual after-tax spending · $3,500 monthly Social Security at 67
$15K today · $9K annual contributions · $25K per college year
Illustrative sample data and assumptions. Simulations illustrate possibilities, not forecasts or guarantees.
Redirect new contributions toward underweight bonds.
FXNAX location. Consider an allocation-neutral FXNAX/FXAIX swap after confirming plan availability and tax details.
Stocks are +16.1 percentage points over target and bonds −10.5 points under.
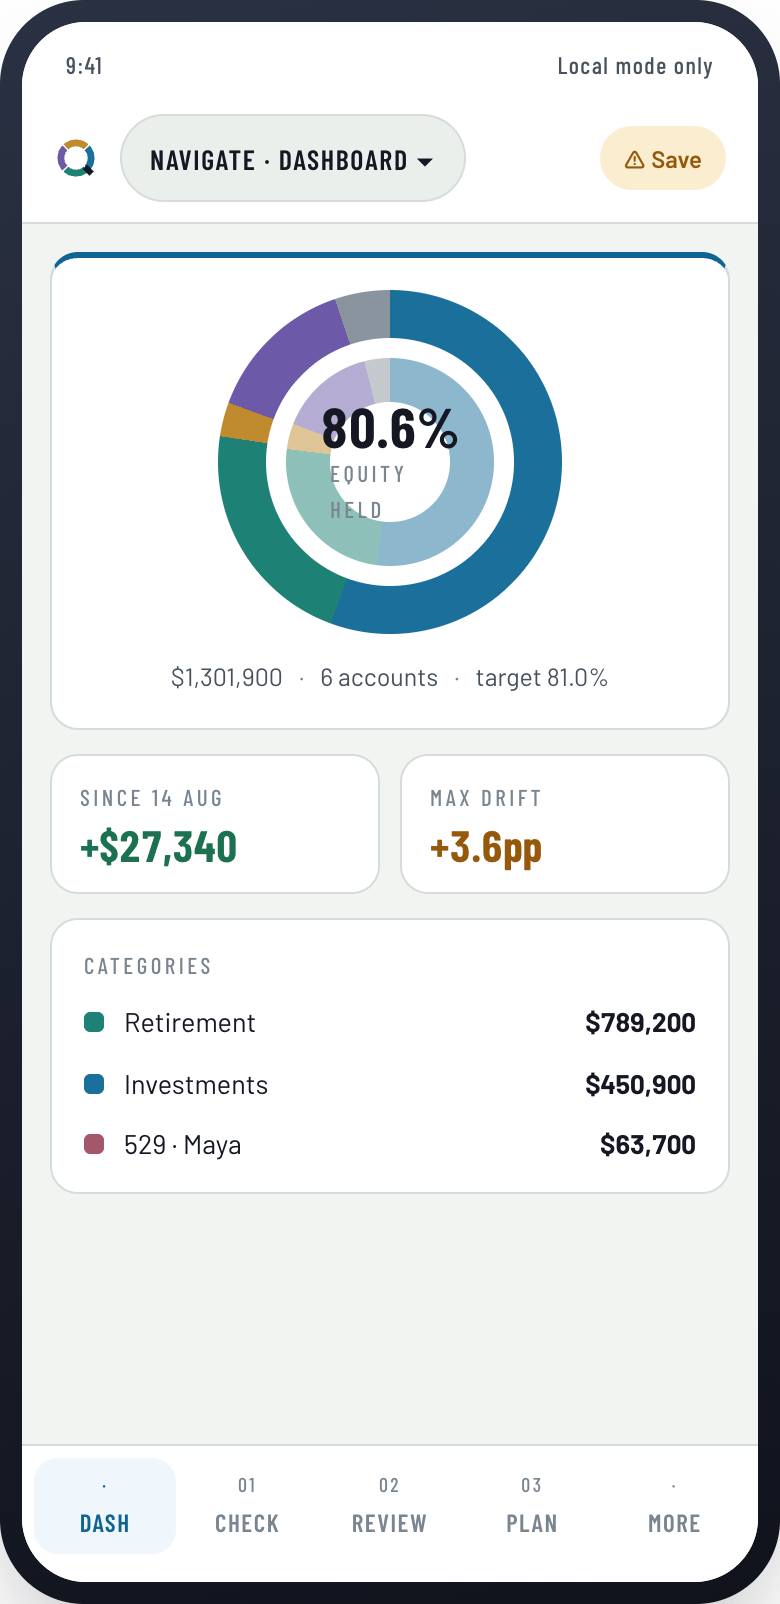
Quartermaster doesn’t connect to your financial accounts or upload your holdings. Your work stays in a private portfolio file that you save and reopen.
No affiliate commissions · no products to sell · no custody or trading
Introductory release—your feedback helps decide what Quartermaster improves next.